Python for Data Science
From Data to Decisions: Making Sense of the Numbers
Course Overview
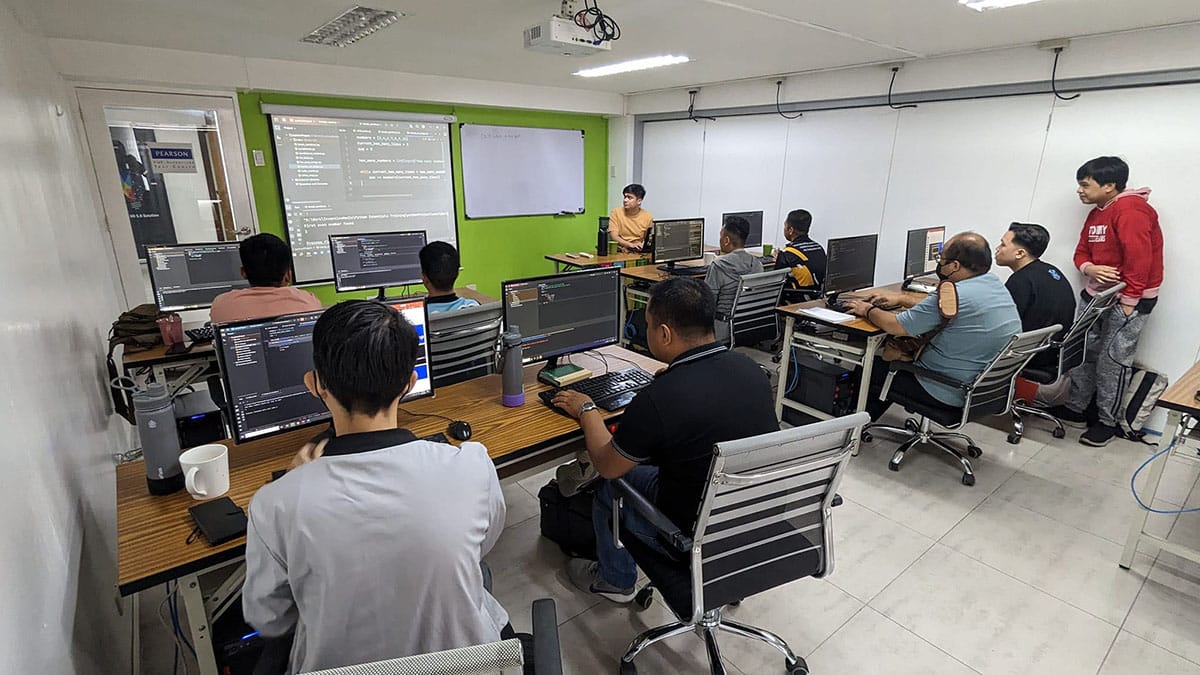
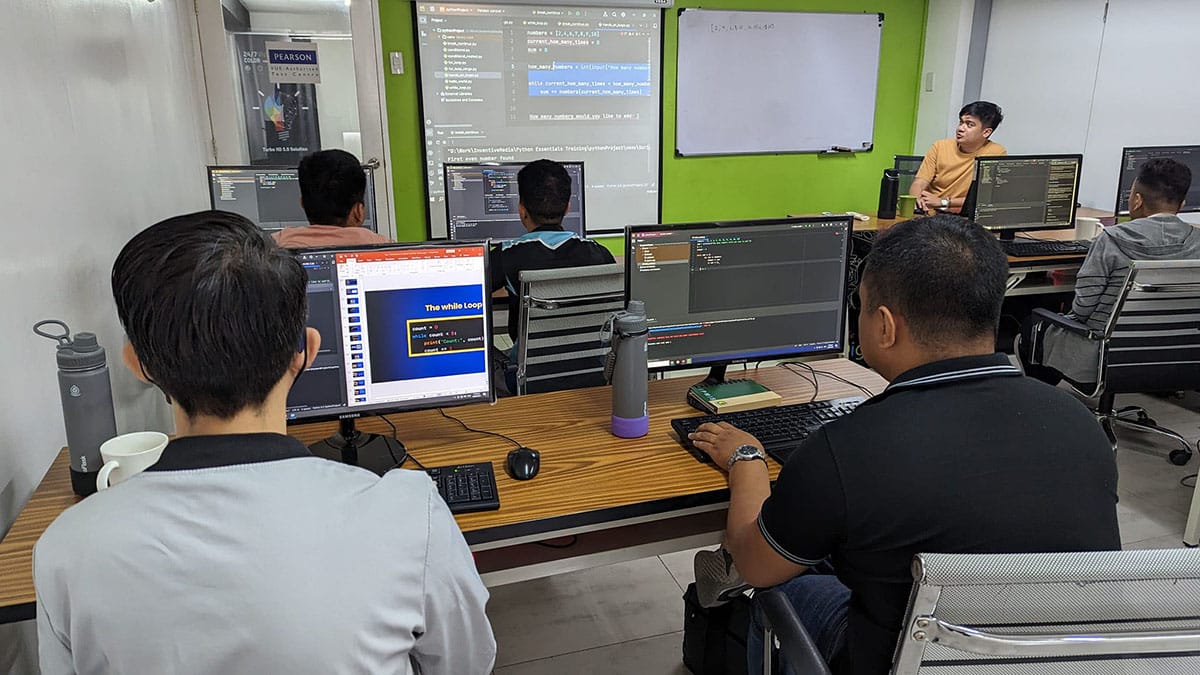
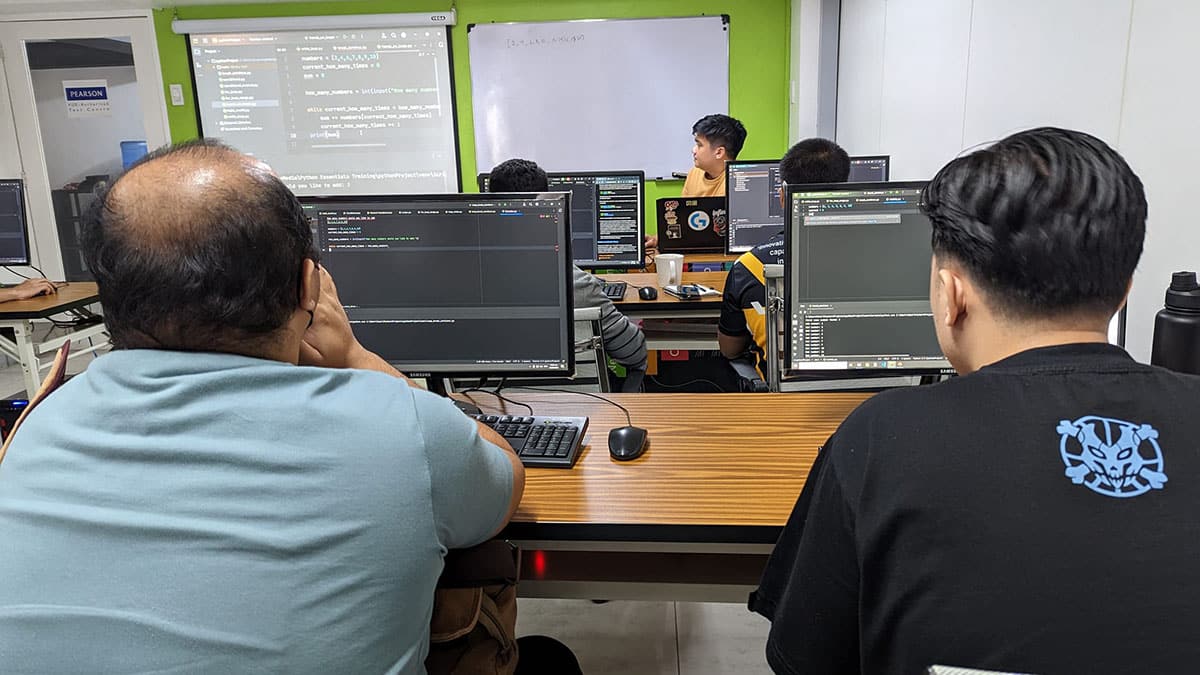
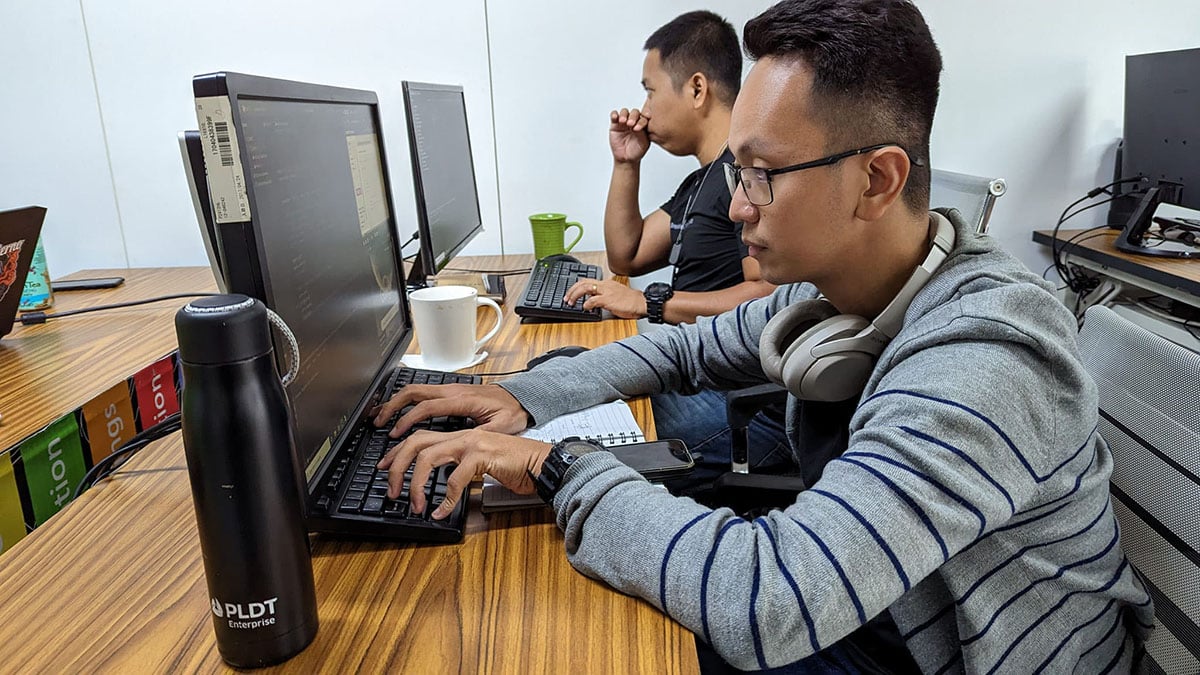


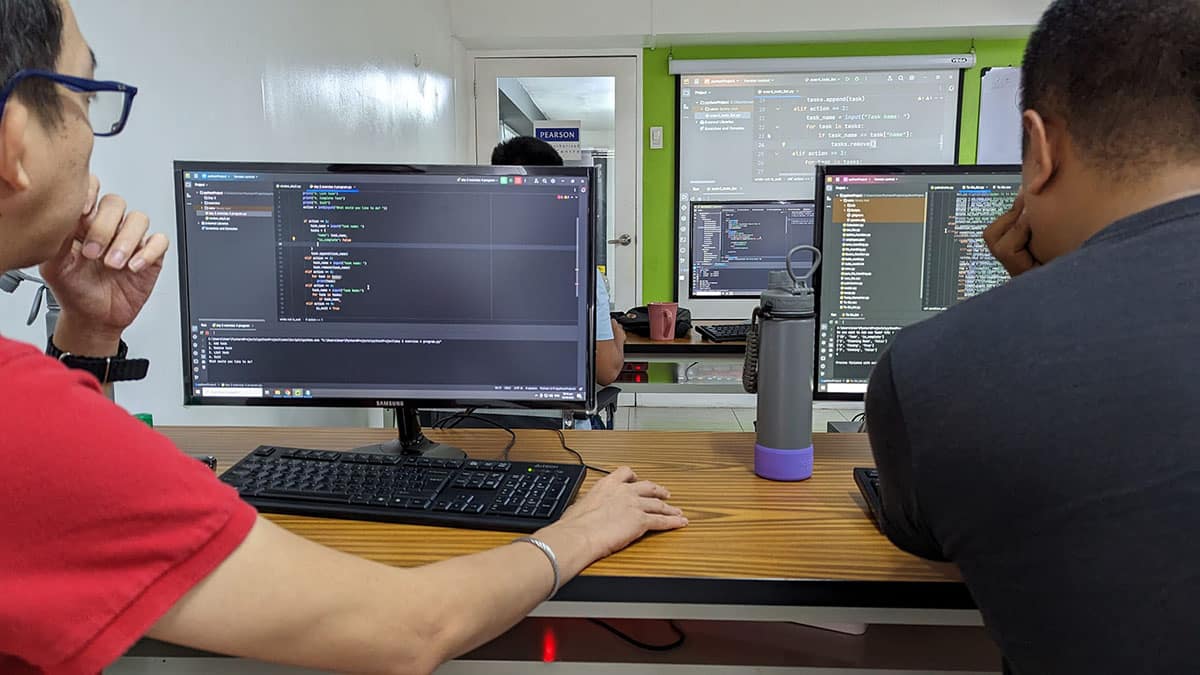

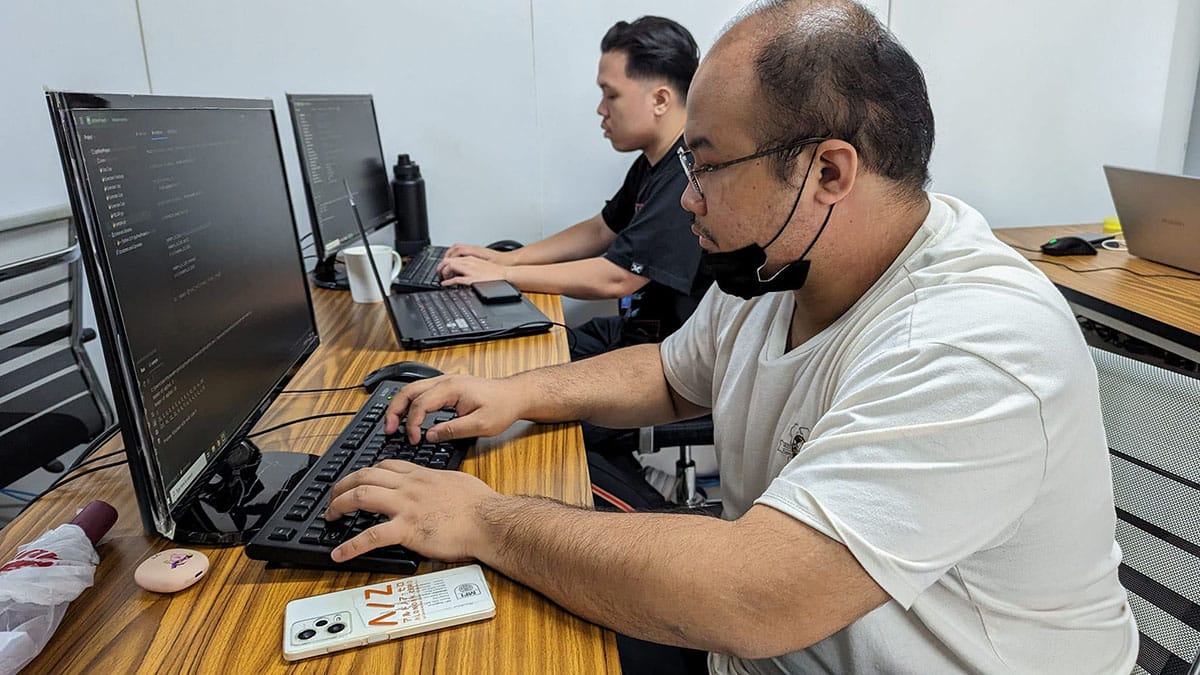
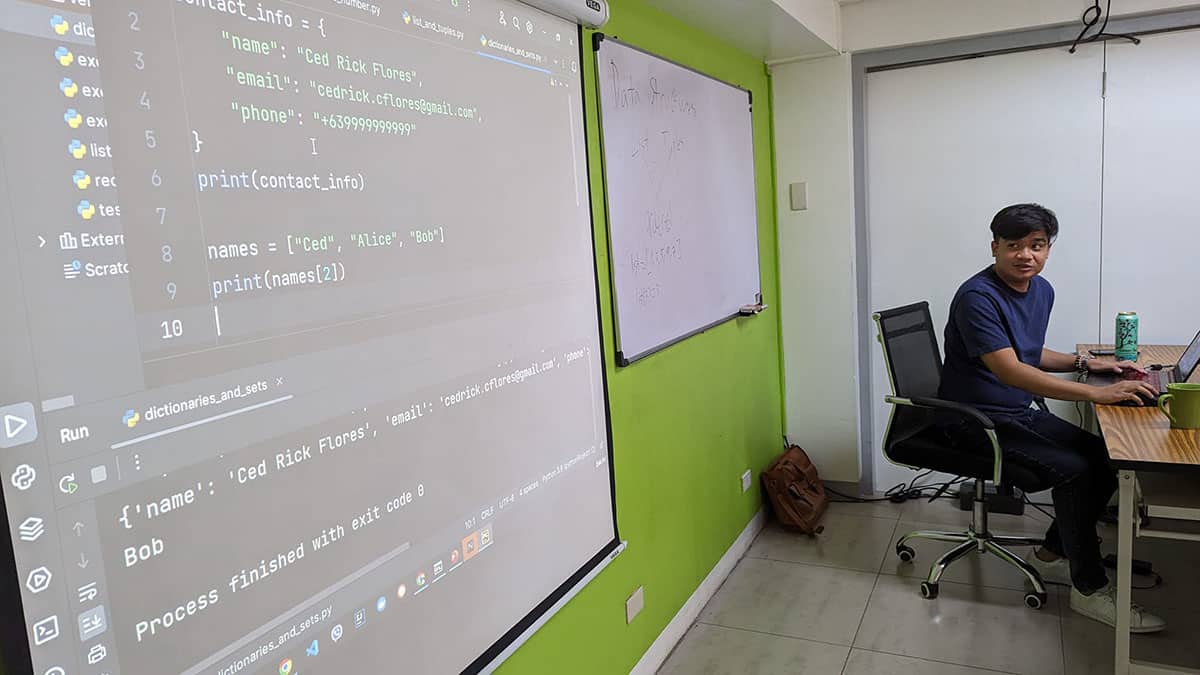

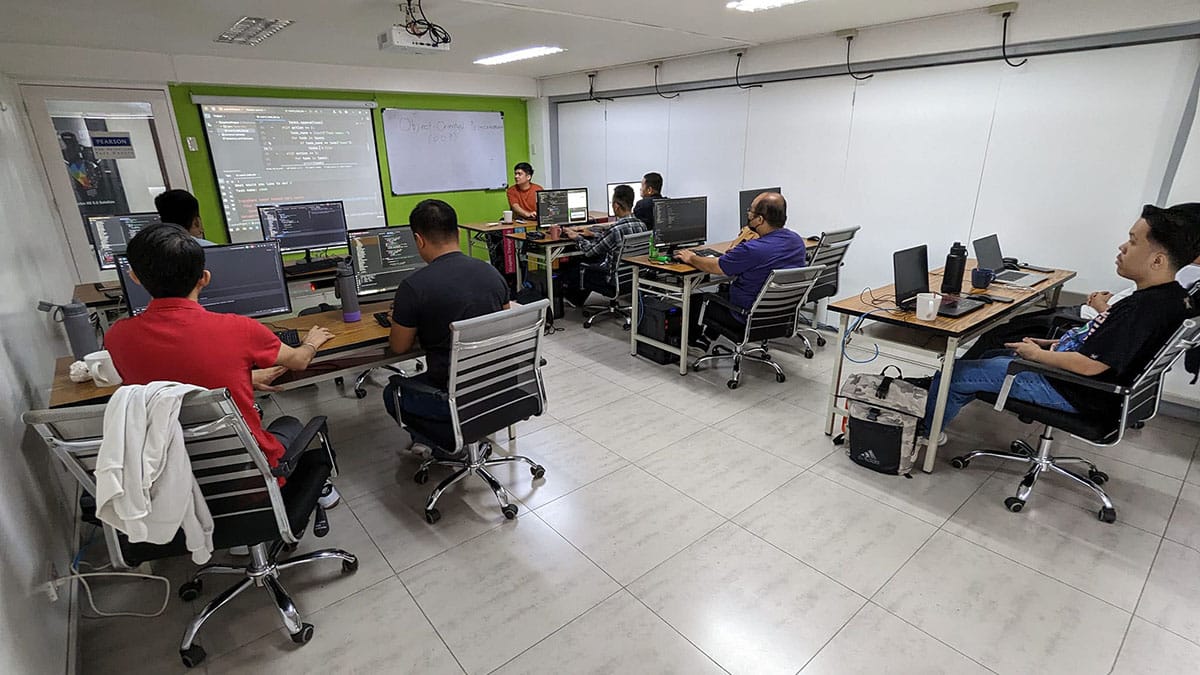
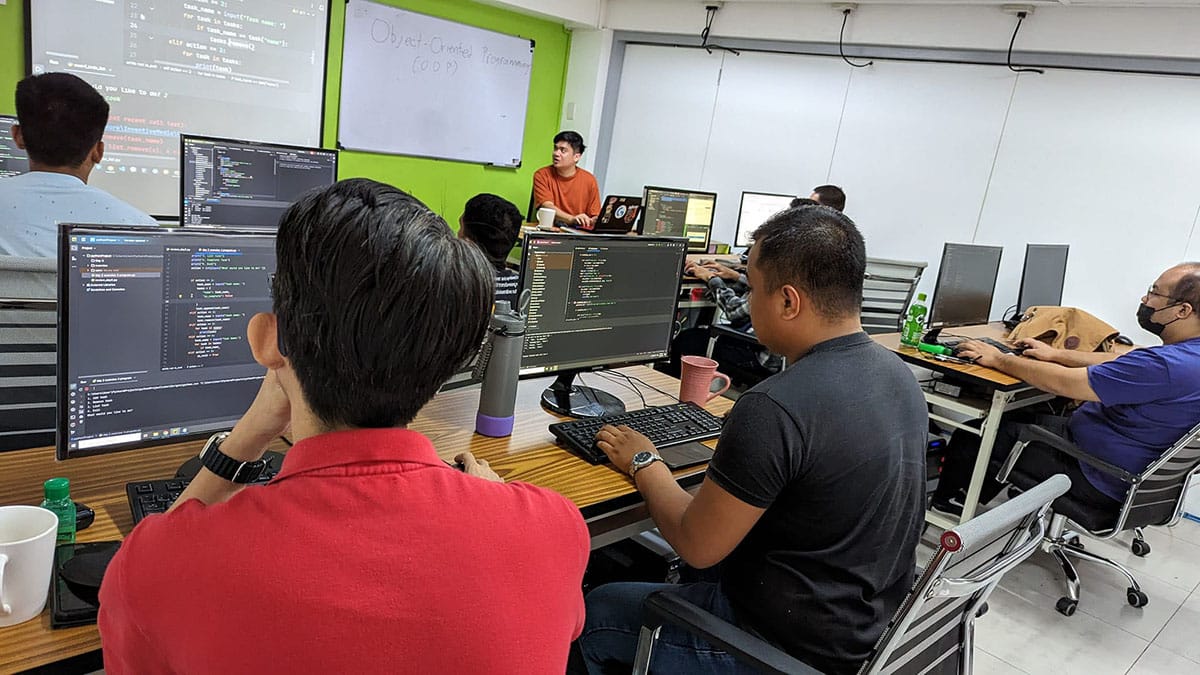

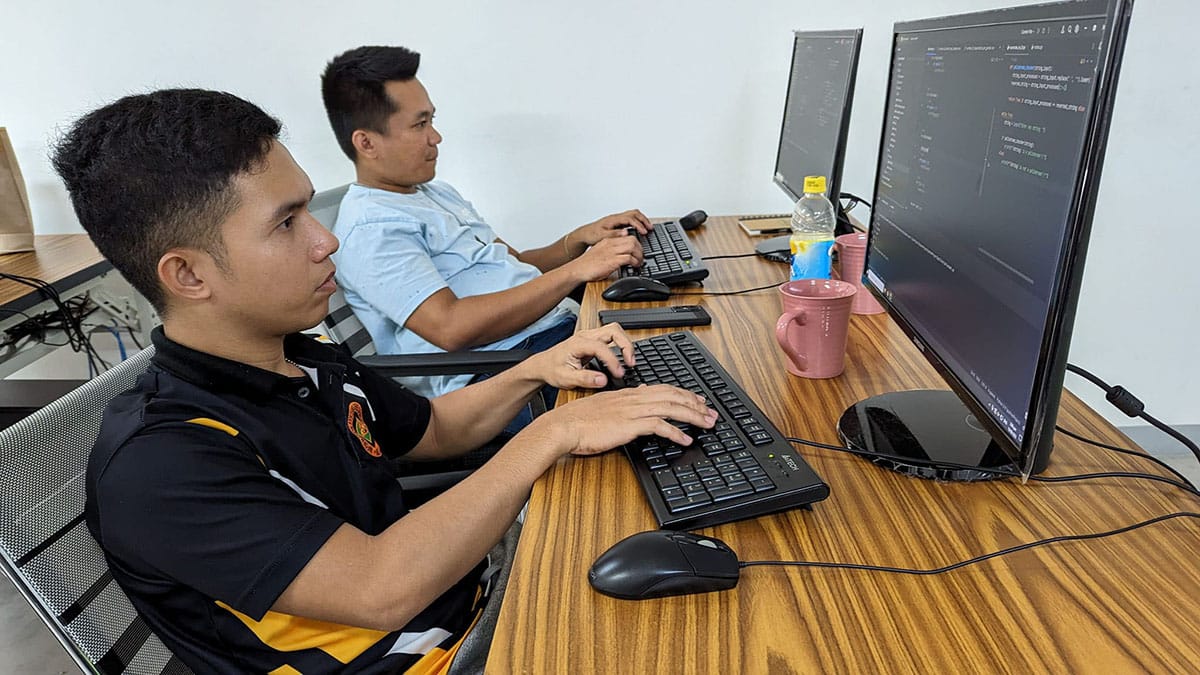
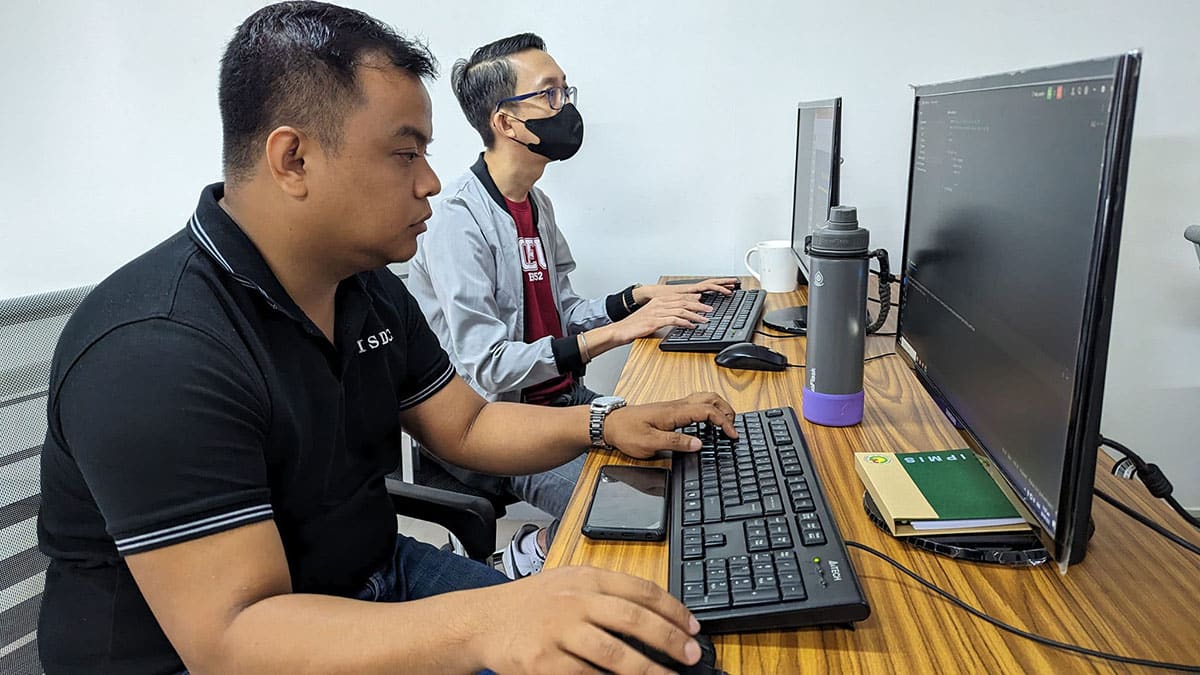
Ranked as one of the Best Schools for Web Development
- Our founder, Henry N. Ong II, is the recognized pioneer of CMS web development courses in the Philippines
- First school to offer WordPress, Joomla & Drupal Classes since 2006
- First school to offer Laravel Class since 2014
- First school to offer Bootstrap Class since 2014
- Pearson Vue Accredited Testing Partner
- PhilGEPS Accredited Center
- Globally Recognized Course Certificate
- Around 85% of government agencies and LGUs take web Development classes from us
Frequently Asked Questions
- Basic Computer knowledge and Skills in PC or Mac.
- Have completed the Python Programming Essentials course.
- Has extensive work experience with intermediate programming.
- Certificate of course completion
- Training references (PDF)
- Exercise materials
- Some add-ons
- Free trainer consultation
- Unlimited Free Retakes
Unlimited Retakes = Unlimited Hours of Learning!
We understand that individuals have different learning styles and paces, that’s why we offer the opportunity to learn at your own speed. If you need more time to grasp a concept, you are welcome to come back and retake the class at no additional cost. We believe in providing students with the support they need to succeed.
To Avail: Finish the course to qualify for the unlimited refresher classes
Validity: 1 Year
- Beginners in Data Science: Ideal for those new to data science, offering a foundational understanding of key concepts.
- Aspiring Data Scientists and Analysts: Provides essential skills for those pursuing careers in data analysis, machine learning, and data-driven decision-making.
- Software Developers: Developers looking to expand into data science and machine learning can use this course to acquire the necessary skills.
- Business Professionals and Entrepreneurs: Ideal for those who wish to leverage data analysis for business decisions and automation
- Researchers: Individuals conducting research that involves data analysis or statistical modeling will benefit from this boot camp.
- Career Changers: This course is designed for people aiming to switch to a career in data science or analytics, offering practical, hands-on skills.
Data Science is a multidisciplinary field that combines statistics, data analysis, machine learning, and programming to extract insights from structured and unstructured data. It involves collecting, cleaning, and analyzing data to inform decision-making and predictions. Data scientists use a variety of tools and techniques, including Python, R, SQL, and machine learning models, to uncover patterns and insights in large datasets.
- In-demand Skillset: Data science skills are highly sought after across industries, offering abundant career opportunities.
- Versatility: Data science can be applied in various fields such as healthcare, finance, marketing, research, and more.
- Hands-on Learning: This boot camp focuses on practical experience, allowing participants to work on real-world projects and case studies.
- Career Growth: Mastering data science techniques can open doors to advanced roles in data analysis, machine learning, and business intelligence.
- Problem-Solving Skills: Data science fosters critical thinking and problem-solving skills, valuable for any career.
- Statistical Foundation: Understanding statistical methods and probability is key to making informed, data-driven decisions.
Course Outline
Day 1: Foundations of Data Science
Introduction to Data Science and Analytics
- Course Introduction
- Definitions and Terminologies
- Data Science Workflow
- Career Landscape
Project Management
- Packages Management with Conda
- Version Control with Git
- Introduction to Jupyter Notebooks
- Hands-On: Setting up your project
Python Essentials
- Refresher: Data Structures and Control Flow
- Functional Programming
- Pipeline Workflow with Comprehension
- Code Review: Common Code Snippets
- Hands-On: Exercises in Data Processing
Introduction to Pandas
- Pandas Data Structures (Series and DataFrame)
- Data Slicing and Filtering
- Fundamental Operations and Data Manipulation
- CBasic Data Visualization and Matplotlib and Plotly
- Hands-On: Employee Engagement Report
Day 2: Data Processing
Introduction to Data Analysis
- Descriptive Statistics (Central Tendency, Variability, Frequency, Distribution)
- Variable Relationship (Covariance, Correlatiton, etc.)
- Choosing the right visualization
- Case Studies: Analyzing Public Datasets
- Hands-On: Job Market Trend Analysis
Fundamentals in Probability Theory
- Probability Distribution in Real-world Applications
- Hypothesis Testing
- Case Studies: Review of Research papers
- Hands-On: Research Analysis
Feature Engineering with Numpy
- Introduction to Tensors
- Feature Shaping and Transformation
- Feature Creation and Selection
- Case Studies: Analyzing Large Datasets
- Hands-on: Dataset Feature Extraction
Day 3: Intermediate Techniques
Regression Models
- Linear Regression Model and Metrics
- Logistic Regression Model and Metrics
- Case Studies: Regression on Public Datasets
- Hands-On Exercises: Performance Predictions
Introduction to Machine Learning
- Conceptual Discussion and Terminologies
- Custom Model Creation and Design Considerations
- Case Study: Fraud Detection
- Hands-On Exercises: Image Classification
Text Analysis
- Introduction to Regular Expressions
- Natural Language Processing Techniques
- Using SpaCy and NLTK for Text Processing
- Case Study: Exploring common use cases
- Hands-On: Sentiment Analysis on a Text Dataset
Day 4: Data Presentation
Intermediate Data Visualization
- Customization and Layout Options for Plotly
- Multivariate Data Visualization Techniques
- Data Time and Multi-Index Handling
- Code Review: Common Code Snippets
- Hands-On: Data Visualization Challenges
Introduction to Streamlit
- Description and Motivation
- Streamlit Output Components (Text, Buttons, Sliders, Plotting, etc.)
- Streamlit Input Components (Radio Buttons, Text Input, Select Box, etc.)
- Advance Components (Tabs, Cache, State, Markdown, HTML, etc.)
- Hands-On: Data Analysis Dashboard
Storytelling
- Connecting with the Audience
- Handling Structure and Complexity
- Best Practices and Techniques
- Hands-On: Crafting a story from analysis results
Final Project
- Developing a Complete Report Dashboard from scratch
- Open discussion, questions, and further resources
- Closing Remarks
Single Course Discount
Group Discount
About the Registration
Feel free to register! Registering does not commit you to paying for the course immediately. Registration helps us track attendee numbers and enables us to stay in touch. Payment will only be requested once the course is confirmed to proceed.
Note: When choosing a schedule, you are limited to the available training dates posted on our website.